OEE - Overall Equipment Effectiveness
Since its original development in Japan in the 1970’s OEE or Overall Equipment Effectiveness has become a widely used metric for measuring manufacturing efficiency. OEE is the main tool of the Total Productive Maintenance improvement program and is used to reduce or eliminate the “Six Big Losses” that limit production.
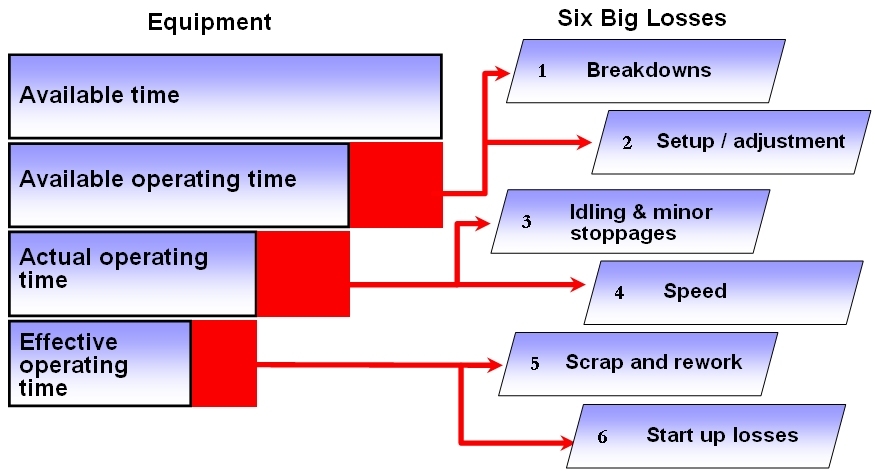
The Six Big Losses are divided into three categories of machine related losses - Availability, Performance and Quality.
Availability relates to time lost during the scheduled operating period due to breakdowns & waiting.
Performance relates to lost units of production compared to designed or historically best output due to minor stoppages or adjustments, reduced running speed, material shortages.
Quality relates to the ratio of good and poor quality product due to scrap & rework, start-up losses.
The product of these three factors equals the OEE value which is expressed as a percentage.
OEE = Availability rate x Performance rate x Quality rate (%)
In a perfect world there would be no losses and therefore the OEE value would be 100%. In fact, the generally accepted level of World Class OEE is around 85%. Although some manufacturers now exceed this figure most struggle to achieve OEE of 65%.
With OEE you can tap hidden capacity in your production process. Used methodically OEE gives you a way to identify and quantify losses, poorly performing assets, balance production flow and track how changes that are made affect overall effectiveness.
OEE Data Collection
The simplicity of the OEE formula makes it easy to introduce manually into any organisation and there are advantages to operators collecting the data by hand as it allows them to recognise the factors that limit production. However, there are a number of problems that manual OEE data collection creates - especially when there are a large number of machines or equipment. These include:
- Cost - manual collection and processing takes up staff time
- Accuracy - manual data collection introduces estimations and errors
- Timeliness - there is always a lag between collection of data and processing
If you have more than a few machines you soon generate masses of data. Processing it takes a long time and getting useful information out becomes very difficult. As manually collected data introduces time estimations and inaccuracies you can never have total confidence in the resulting OEE values.
To aid data processing there are OEE software packages available that still rely on manually collected or directly inputted data. These provide an ‘off line’ approach to OEE but as the results they provide are only as good as the data being entered, they are no more accurate than manual processing.
Record, Analyse and Track All Downtime
Only fully connected OEE systems that monitor machines and assets in real-time, such as PlantRun, eliminate the problems associated with manual data collection. This is done by connecting directly to machines and assets and continuously monitoring their status and throughput.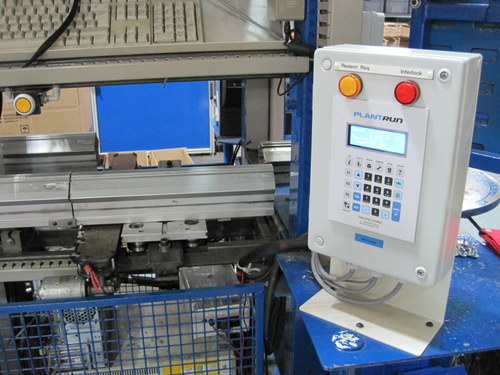 This ensures that all machine stoppages are recorded with an accuracy to one second - including all the short stops of just a few seconds that add up to large losses. The machine operator selects the reason for major stoppages using an interface sited adjacent to each machine. This keeps the operator involved in the resolution of problems and can often provide more detailed downtime reason information than can be captured directly from a machine PLC if it has one.
Operator interfaces are available in different formats including outstations, PC, touch screens and tablet.
Operator outstations are rugged and compact, featuring a keypad and multi-line display. They allow the operator to log on & off, stop and start production, select downtime reasons and view key metrics such as current and target production rates, without having to leave the machine area.
PC, touch screens and tablets feature the same interaction as outstations and even more functionality through their graphic screens.
An electrical interlock can be enabled, effectively preventing the machine or asset from being restarted until the operator selects a reason for any major stoppage - this ensures that reasons are recorded. Machine speeds are monitored to warn of slow running and to enable machine speed optimisation. Reasons for out of range speed can be captured in a similar way to downtime reasons.
In effect any time related actions can be accurately recorded, tracked and analysed. For example, it is possible to segment and record the sequence of any breakdown, changeover, setup, materials or operator waiting times. This gives you all the information regarding Availability and Performance allowing you to fully understand where your manufacturing losses originate.
Quality Control
Quality rate is crucial to OEE calculation. PlantRun can accept a simple count of reject, defective or scrap product if this is available or connect to thousands of different industrial measuring and monitoring devices for automated quality checking. Alternatively scrap data can be input at the operator interface or via spreadsheet at any time. Scrap values can be in units, weight, length, part pack count etc. Where yield calculation is required the starting raw material weights can be entered and PlantRun can derive the yield from the finished good product count. Furthermore, and unlike most OEE systems, PlantRun can also handle any process values (temperature, pressure, humidity etc.) that may be critical to the quality of your products as well as provide any level of control that may be required.
Production Dashboards
Delivering information is at the heart of these systems. Dashboards give you instant access to the information you need, whether you are focusing on the performance of one or any number of machines or assets or want to analyse or compare products, batches, personnel, shifts, changeovers, downtime, scrap etc.
In and of itself OEE is of limited value for continuous improvement. You also need to know where the losses are occurring and a "Quick Statistics" tool does this by highlighting the most significant losses - exactly where you should target resources for best return on investment. You can then track changes over time to see the effect any continuous improvement initiatives have had.
Distribute Information Enterprise Wide
Getting the right information when and where it is needed is a strength of PlantRun. A range of options enable users access from their desktop PC or laptop wherever they are - in the production area, office, head office or overseas. This includes the viewing of data from multiple sites or geographies.
To allow you to see the status of all machines at a glance from your PC, display screens give a colour coded visual representation of your production area. OEE values and a range of other KPI’s can be displayed on screen in real-time.
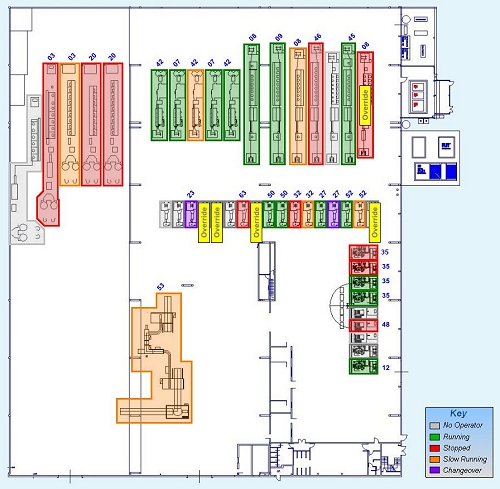
OEE, actual and target production rates can be displayed on large format display screens in the production area to motivate operators. These screens can display any relevant information and act as andons for assistance requests.
oee displays
Faster Response to Problems As They Occur
Alarms can be set on any monitored parameter to alert when problems occur allowing for fast response to minimise production disturbances. Crucial alarm information can be sent by email or mobile phone SMS message, as well as triggering local sounders, beacons, public address message or system displays.
Andon call for assitance
Staff can send request for attention from the operator interfaces. Typically used to call an engineer to a breakdown this facility can also be used to call a team leader, for materials etc. Response and resolution times are tracked which are useful metrics for maintenance departments. Requests are sent in various ways including SMS text message, email, public address, andon boards etc.
Management Reports
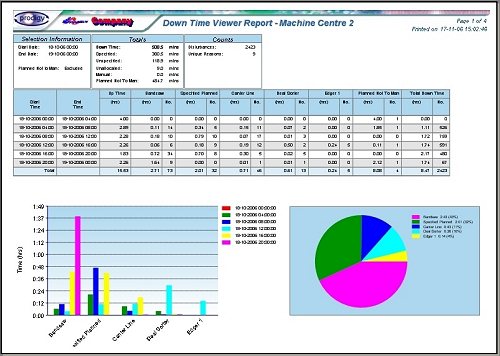
Creating management reports is as simple as selecting one of the built in report templates and filtering on the data you want. Report templates can be text, graphic, tabular or any combination. A comprehensive range of ready to use templates are built in and it is easy to edit or create custom templates as and when you need them. Reports can be generated to a printer, sent to email, via SMS or to pdf for efficient archiving and digital distribution. Data can be exported for use in your preferred reporting tool.
PlantRun is complemented by a range of hardware including shopfloor operator terminals, touch screen terminals, barcode scanners, swipe-card & RFID readers and large format shopfloor display screens.
Achieve World Class Manufacturing Efficiency
Achieving World Class OEE levels is when a fully connected OEE system comes into its own. Early efficiency gains are relatively easy. It is when you approach optimum efficiency that you meet diminishing returns - every extra percentage improvement becomes more difficult to achieve.
This is when fast access to highly accurate information is crucial to target efficiency improvements and a way of easily seeing what progress is being made. The extra efficiency gains a PlantRun gives you makes it very cost effective with current users reporting typical payback of less than twelve months. For a fast budgetary price complete the form below.
Related articles;
OEE Systems
OEE Data Collection
Resources
https://en.wikipedia.org/wiki/Overall_equipment_effectiveness
